Shaded Relief Maps
Started practing with another form of data visualizations.
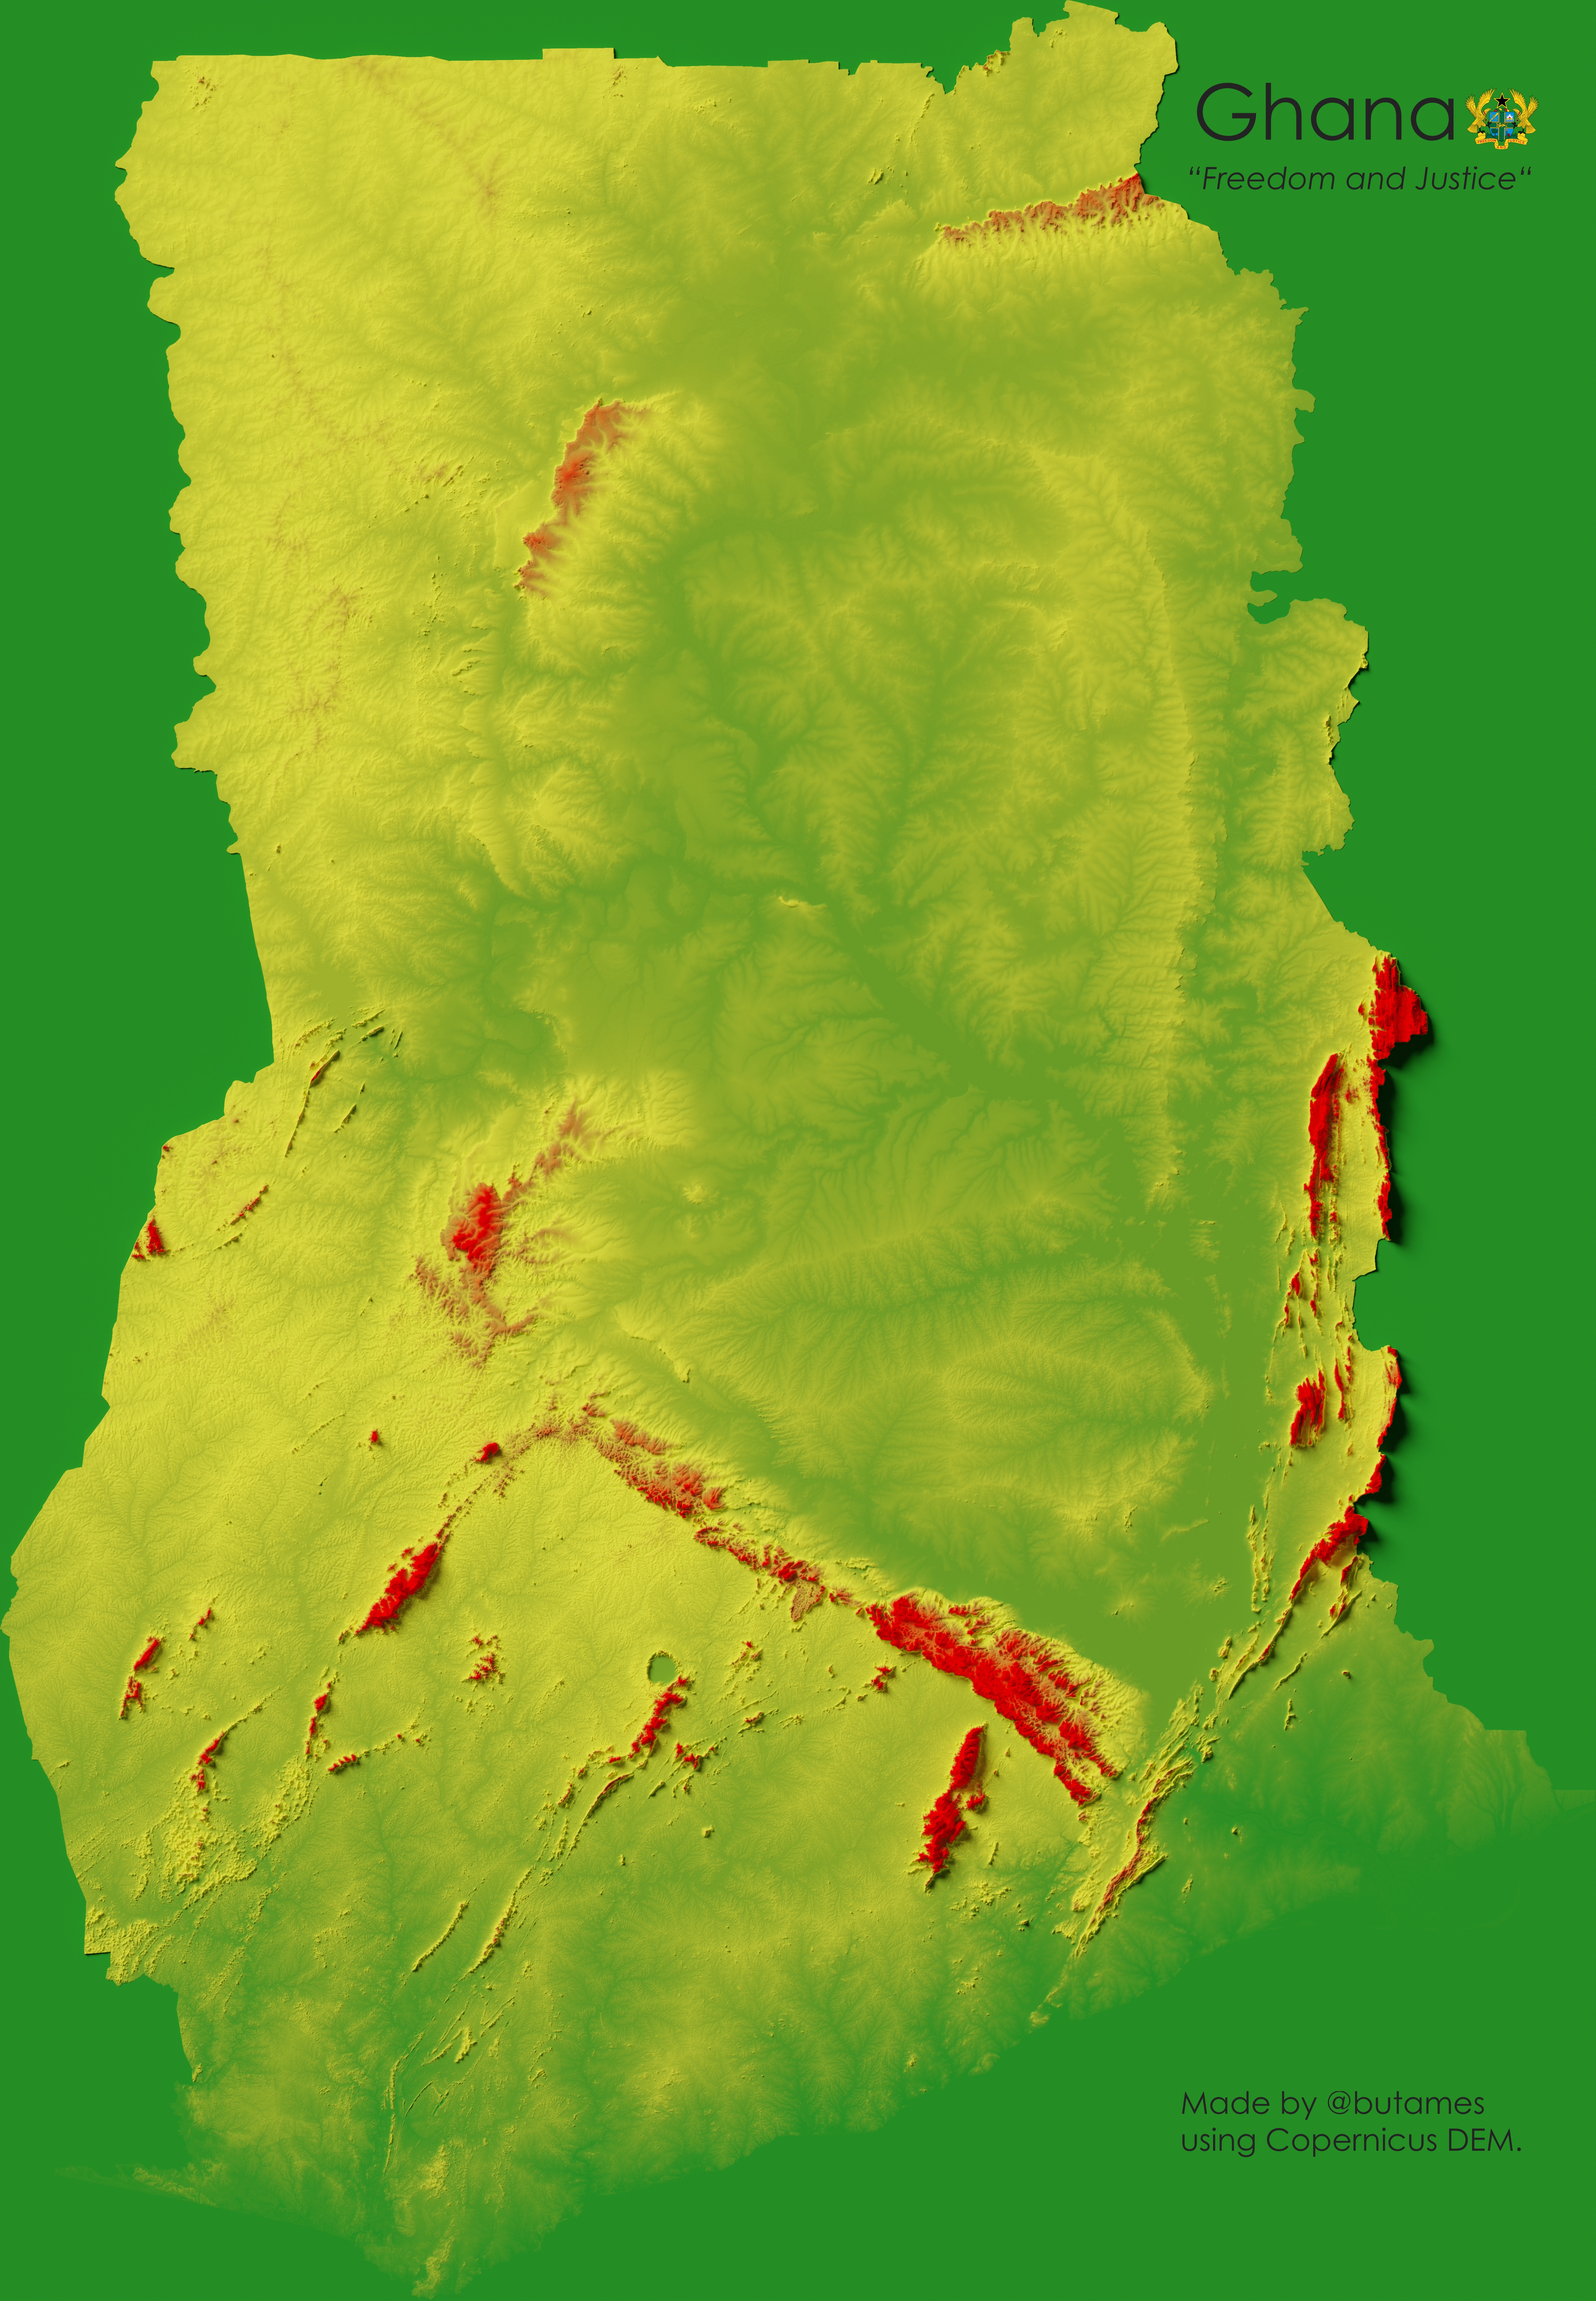
Recently, I have found myself playing with creating relief maps, which is another form of data visualization. I was on Etsy.com and saw some beautiful posters showing relief maps of some mountainous areas and wondered how they were created. So, I fired up my trusty Google machine and found some great tutorials. The tutorial I found uses QGIS to clip digital elevation model (DEM) of a specific area and then utilizes Blender, an open-source 3D software, to render 3D looking shaded-relief maps. It is a tedious process, and I have a much greater appreciation for animators’ work for film and television. One of the more challenging parts of this process has been applying color palettes to help the relief features stand out. Anyway, I think I have some hang of it after some trial and error, but I continue to practice. Below is a shaded relief of Ghana. In a nod to our recent birthday, I tried to use the colors in Ghana’s flag, Green, Gold, and Red. The Red represents the higher elevations, while the Green captures the lower areas, and finally, Gold/Yellow is the mid- (comparatively speaking) relief area.
Perhaps if I ever become an expert, I will post my version of the tutorial. At present, I am grateful to the tutorial provided by Daniel Huffman; Something About Maps - Creating Shaded Relief in Blender.